Archives

Gay Marriage Kiss

Gay Marriage is Legal. Are the Wedding Bells Ringing?

In June, the Supreme Court of the United States laid down an historic ruling declaring the ban of same-sex marriages at the state level to be unconstitutional, effectively legalizing same-sex marriage across the country. The change had been a long time coming. The 1970s saw the first wave of legal efforts to recognize same-sex marriage, and yet only in 2004 were the first such marriages performed on US soil, in the state of Massachusetts. Over the next decade, the dominoes began to fall in states across the country, culminating in this year’s landmark Obergefell v. Hodges ruling. But the United States was of course not close to being the first nation to take this step: all the way back in 2001, Netherlands became the first country to allow same-sex marriage, followed in the next several years by Belgium (‘03), Spain (‘05), Canada (‘05) and South Africa (‘06). As of today, 20 nations (and a few jurisdictions in Mexico) permit same-sex marriage.

But after the initial flurry of excitement has died down, and the queues for marriages licenses at city hall have subsided, what happens next? How often are same-sex marriages actually performed in these countries? We dug into the numbers, and discovered that in some nations, like Belgium, same-sex marriages have become remarkably commonplace and are warmly accepted by fellow citizens as part of the cultural fabric of the community. On the other hand, in countries like Portugal and Norway, same-sex marriages remain surprisingly uncommon; for Portugal, this is due in part to the powerful influence of the Roman Catholic church in everyday life, while Norway’s low rate is a result of its longstanding (and popular) civil union laws, as well as the still powerful influence of the country’s Lutheran clergy. As recent court cases in the United States involving Christian wedding bakers and florists suggest, just because same-sex marriage is legal, it doesn’t mean that there is an accepting environment for it.

In our analysis, we examined countries where marriage data (both same and opposite sex) is publicly accessible, and where same-sex marriage has been legal for at least two years (so that the marriage rate has time to stabilize after the initial post-legalization spike). This allows us to consider the nations of Belgium, Canada, the Netherlands, Norway, Portugal and Spain, as well as the US state of Massachusetts.

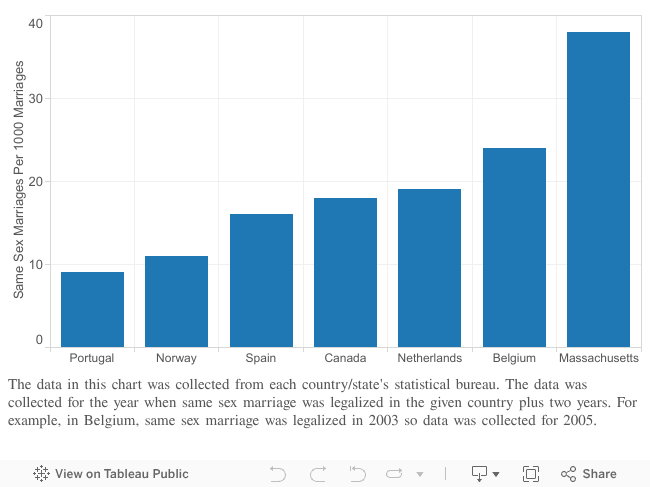
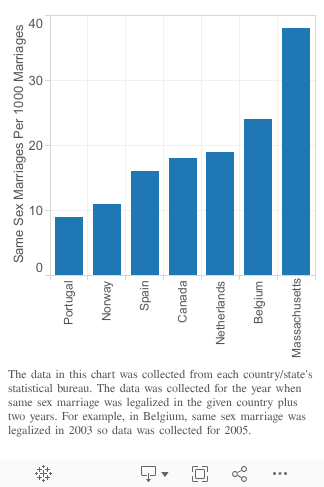
To understand and compare how commonplace same-sex marriage has become across these jurisdictions, we examined the rate of same-sex marriages per year relative to a country’s total marriage rate, two years after legalization took place. In particular, we calculated the number of same-sex marriages performed per 1000 total marriages (both same-sex and opposite-sex). Focusing on the relative rate of marriages (as opposed to absolute numbers) helps control for the varying overall marriage rate in these countries (the US marriage rate is over 50% higher than that of Spain, for example), and so the relative rate can be viewed as a proxy for a country’s acceptance of same-sex marriage. Moreover, looking at a two year time horizon post-legalization allowed us to make a meaningful comparison across countries (which have varying dates for legalization) while ensuring that the post-legalization spike in numbers had subsided.

Leading the way for gay marriage

The first country to legalize same-sex marriage – the Netherlands – became a global leader of gay rights when marriage equality was enacted in April 2001. The country had allowed same sex civil unions since 1998 and the push towards civil marriages for same sex couples quickly followed, despite opposition from religious parties in the government.

In the Netherlands, the data shows a rate of 19 same-sex marriages per 1000 marriages, comfortably in the middle of the pack among nations that we examined, suggesting that the Dutch hold a relatively welcoming attitude toward their LGBT community. The country is certainly known for its liberal views (the mayor of Amsterdam even officiated the first gay weddings in the country), and the ‘matter-of-fact’ attitude toward LGBT equality in the Netherlands has fostered a society comfortable with gay marriages and an extension of other rights, including adoption, when marriage equality was passed. Unlike other countries that allowed foreigners to wed, however, only Dutch nationals were permitted to legally marry under the new law, which is why the numbers may not be even higher for this pioneering country.

Belgium stands out as the country with by far the most same-sex marriages relative to all marriages in our set (the US state of Massachusetts is still higher). The country has a long history of progressive attitudes toward same-sex relations, dating back to the 18th century when homosexuality was decriminalized. It introduced statutory cohabitation for same-sex couples in 1998 and became the second country to legalize gay marriage in 2003. The bill initially only permitted foreigners of the same sex to legally marry within Belgium if their country of origin also allowed gay unions, but this was amended in 2004 to allow marriage if at least one person had resided in Belgium for at least three months. Belgians’ approval ratings towards LGBT rights is currently one of the highest in Europe, and the country’s reputation as being on the vanguard of equality is apparent in its selection of leaders (former prime minister Elio Di Rupo was the world’s second openly gay head of state), as well as its liberal policies toward issues like adoption, IVF and anti-discrimination legislation.

Canada was the first country outside of Europe to legalize gay marriage in 2005, although it had been legal in eight out of ten provinces with laws starting in 2003. At the time, Canada was the only country where neither party needed to be a resident to obtain legal marriage status; as a result, Canada became an international gay marriage tourism hub, especially for those from the United States prior to legalization there (at one point over half of same-sex marriages involved non-resident couples). Canada’s relatively open immigration policy also encouraged foreign same-sex couples — many from the US but also from nations quite hostile to homosexuals — to settle in the country, get married, and start a new life. The country has largely been viewed as leader in human rights and equality, and the recent US Supreme Court decision down south has attracted a mixture of smugness and cheer.

Change begins in America

It’s no secret that same-sex marriage has been a topic of heated debate across the United States, so when Massachusetts became the first American state to legalize gay marriage in 2004, it was both momentous and controversial.

Massachusetts has legally protected gay rights since 1989, prohibiting discrimination based on sexual orientation. Eleven years later, the state extended the rights and privileges of marriage to same-sex couples through legislature that established civil unions. Finally, after an incredibly hard-fought victory, gay marriage was legalized in Massachusetts in 2004.

Anyone from the country, or the world for that matter, was legally allowed to marry in Massachusetts, and indeed many out-of-state couples took advantage (adding an estimated $111 million to the state’s economy over the first five years). This feature, along with Massachusetts’ three year monopoly on gay marriage, likely accounts for the state’s remarkably high rate of same-sex marriages. Following the court decision in Massachusetts, 30 states passed constitutional bans on gay marriage by 2008, further highlighting the state’s progressive attitudes.

Marriage equality, but different attitudes

In other nations where gay marriage has been legalized, changes in legislation have been met with decidedly more mixed attitudes. While Spain has been ranked high among the best countries for gay rights, the LGBT population there is also the country’s biggest target for hate crimes. The country has a history of exercising strict control over social freedoms – divorce, abortion and homosexuality were illegal under the dictatorship of Francisco Franco until his death in 1975; yet now Spain is regarded as a country with some of the most liberal attitudes (at least in terms of legal language) toward gay rights in the world. The 2005 ruling indeed went further than laws in many other nations, awarding gay couples all the same rights as heterosexual couples, including divorce and adoption.

Marriage equality in Spain has faced strong resistance from conservative parties and the Roman Catholic Church since it was legalized, causing a spike in marriages in 2006 as many were unsure if the law would be upheld in subsequent governments. Numbers have since settled to around 3000 each year, and Spanish attitudes toward gay marriage have steadily become more favorable. Although a relatively lower rate of same-sex marriages than other countries, Spain’s pioneering legal decision in gay rights paved the way for other European countries to do the same – especially those with large, deeply religious populations.

While Portugal was the sixth country in Europe to legalize same-sex marriage (in 2010), the ruling has remained a hugely controversial one in the country, and the rate of same-sex marriages remains small (lower, in fact, than in all jurisdictions that we examined). Like Spain, Portugal has a large Roman Catholic base – roughly 90% of the population – and the nation’s Roman Catholic church (and the Vatican itself) mobilized heavily against the new legislation. At the time of legalization, Portugal’s president suggested that while he did not agree with marriage equality, he didn’t want to prolong a debate when the country was facing other (namely economic) problems. Public opinion polls at the time also showed that a majority of the population was against same-sex marriage.

While the gay population is still stigmatized in Portugal, the country has made strides in moving towards greater equality. There is a constitutional ban on discrimination based on sexual orientation, and a ratified Gender Identity law that greatly facilitates gender reassignment – huge steps for a country where homosexuality was a criminal act up until 1982. While the rate of same-sex marriages remains low, societal attitudes toward homosexuality in Portugal have changed substantially to allow for more acceptance.

Finally, Norway presents an interesting case study: the country has recognized same-sex unions since 1993, and awarded gay couples equal marriage rights starting in 2009, including the rights to adoption and artificial insemination. However, despite the country’s liberal views toward same-sex relations, the Lutheran Church continues to fight against these unions. The clergy is not legally obligated to marry couples of the same sex (around 85% of Norwegians were registered members with the state Lutheran Church in the year same-sex marriages were legalized). This has continued to be a point of controversy, with an ongoing argument over whether full church weddings should be awarded to same-sex couples.

The legality of same-sex registered partnerships since 1993 appears to have depressed the rate of same-sex marriages post-legalization in 2008 (Norway has the lowest relative rate in our study besides Portugal); the 1993 ruling, part of a Scandinavian wave of such de facto same-sex partnership laws in the late 80s and early 90s, means that there really isn’t much impetus for couples to upgrade their status to “married.”

Methodology Notes

The data in used in this article was collected from each country/state’s statistical bureau. The data was collected for the year when same-sex marriage was legalized in the given country plus two years. For example, in Belgium, same-sex marriage was legalized in 2003 so data was collected for 2005.

Data sources

  • Netherlands – Statistics Netherlands
  • Belgium – Total marriage data from Statistics Belgium here. Same-sex marriage data here.
  • Canada – Canadian total marriage data is available from Statistics Canada here. Canadian same-sex marriage marriage data for 2007 was interpolated using Census data from 2006 and 2011.
  • Massachusetts – Provided to The 10 and 3 by the Massachusetts Registry of Vital Records and Statistics. The data is not available online.
  • Spain – Data comes from Spanish National Statistics Institute
  • Portugal – Pordata
  • Norway – Calculated using tables available from Statistics Norway.

Correction: The same-sex marriage rate for Belgium has been corrected to 24 per 1000 total marriages.

Don’t miss our newest stories! Follow The 10 and 3 on Facebook or Twitter for the latest news and analysis.

Don't miss our newest maps, charts and stories. Sign up now to have them delivered to your inbox.

High School Graduation

The Vast Disparity in Canada’s High School Graduation Rates

Compared to their counterparts around the world, Canadian students graduate high school at a respectable, though not spectacular, rate. With 85% of Canadians receiving their high school diploma over the course of their life, Canada manages to slip in just above the OECD average of 84%, well behind education stalwarts like Korea, Japan and the Netherlands, but ahead of other developed nations like the United States, Sweden and Italy.

But taking a closer look at Statistics Canada’s numbers reveals a huge disparity within the country. While the eastern and western ends of Canada (including high population provinces like Ontario and British Columbia) maintain solid graduation rates, much of the centre and north — including education laggards like Alberta, Manitoba and the territories — graduate their students at rates equal to or below those of developing nations like Turkey and Mexico. We dig into a few of these cases below to understand what’s going on.

Ontario (86%)

While now one of the country’s top performers, Ontario has only recently been running up the numbers. In the last decade, Ontario’s high school graduation rate has soared a remarkable 15 percentage points. The province’s education department attributes the gains to its so-called Student Success Strategy, which encourages a variety of vocational and technical experiences to count as progress toward a high school diploma. For instance, the Specialist High Skills Majors program allows grade 11 and 12 students to formulate a specialized industry-focused major (like agriculture, food processing or manufacturing) to help them graduate; moreover, dual credits and an expanded co-op program have made it easier for on-the-job vocational training and post-secondary classes to count toward high school credit.

Alberta (69%)

In 2006, Alberta and Ontario faced similarly disappointing secondary school graduation rates in the high 60s. But while the next decade saw Ontario quickly zoom ahead, Alberta’s rates stagnated and remain below 70% today (similar to low-performing European nations like Austria and Greece). The main culprit appears to be the province’s red hot oil industry, with its well-paying jobs that require little-to-no education. Maclean’s Magazine’s 2008 headline “Dropping out for oil” seemed to summarize the feeling best: why complete an extra year or two of high school when you can starting earning the big bucks now? But with a prolonged bust in the energy cycle now a real possibility, the chickens may be coming home to roost. What will happen to all those unemployed kids who never got a diploma?

Nova Scotia (87%)

Nova Scotia, along with fellow Maritime provinces New Brunswick and Prince Edward Island, have been among the top performing provinces in Canada in terms of graduation rates for well over a decade. Perhaps the most exciting aspect of Nova Scotia’s education system is the remarkably high graduation rates of the province’s Mi’kmaq First Nations community, who graduate over 88% of students that begin Grade 12 on reserves (compared to just 35% for First Nations communities across the country). Nova Scotia uses an innovative system for its Mi’kmaq population, where schools are run not by the province, but by the community itself (an education authority known as the Mi’kmaw Kina’matnewey). Set up in 1999 by the federal Mi’kmaw Education Act, the authority boasts over 50% Mi’kmaq teachers, and a curriculum that stresses Mi’kmaq culture and language.

Nunavut (35%)

Nunavut’s high school graduation rates are shockingly low. At 35%, the fraction of Nunavut adults with a high school diploma is 20 points less than the next lowest province or territory (Northwest Territories), and more than 10 points less than the worst-performing OECD country (Mexico). Nunavut’s social problems are well documented, but contributing to the poor graduation rates in particular is a combination of rampant truancy and an insidious culture of “social promotion,” which encourages passing students from one grade to the next even when they are not ready. As a result, kids who just can’t keep up are simply dropping out of high school (at an astonishing 50% rate).

Quebec (74%)

Quebec’s secondary education system is unique in the country. After Grade 11, students may attend CEGEP, a two-year pre-university college program that one must attend if planning to go to university. CEGEP roughly corresponds to the years that students in other provinces would attend Grade 12 and the first year of university. Moreover, Quebec has a well-developed adult education system that aids those over the age of 16 to complete their high school (i.e. pre-CEGEP) diploma (in every other province, these adult high-school dropouts would instead attend college and would not be counted towards their provincial high school graduation rates). As such, the graduation rate commonly reported by Statistics Canada (93%) overstates the ability of the Quebec education system to graduate its students in a timely manner. Instead, the province’s own 74% estimate (counting percent of youths under 20 that have graduated) shows that Quebec is actually near the bottom of all provinces. One out of five girls, and shockingly, one out of three boys, quit school in Quebec before they graduate.

Methodology Notes

Why look at graduation rates — why not performance? Of course, while graduation rates explain how many people a country manages to usher through its education system, it doesn’t tell the whole story: namely, how ready are students once they’re done? On that measure, on the national level (where data is most reliable), Canada again tends to fall toward the the middle among OECD nations, behind Asian powerhouses like Singapore, Korea and Japan, but ahead of other developed nations like Australia, Spain and the United States.

How does Statistics Canada define graduation rate? From the Statistics Canada site: “Upper secondary graduation rates are the sum of graduation rates by age, and the latter are obtained by dividing graduates of a specific age by the population of the corresponding specific age. Rates without duplication only count individuals who had obtained, during a given year, a diploma at this level for the first time. In general, a graduate of upper secondary education is considered to have successfully completed the last year of education at this level, regardless of his or her age.”

Why do provincial and Statistics Canada numbers sometimes differ? The numbers computed by provinces and by Statistics Canada may differ for a number of reasons including age of the data. We are using data from 2011 as it is the last year for which Statistics Canada has released a dataset that include high school graduation rates across all provinces and territories. It is important to use a single data source when comparing different regions as the definition of graduation rate varies significantly depending on the specific education ministry. For instance, there are different ways of defining the cohort of students being examined, e.g., if someone moves out of province, some calculations will treat this person as if he/she dropped out, and different end points, i.e., when do you officially determine that someone is a drop out? Statistics Canada tries to normalize all of these arbitrary decisions so that the numbers can be meaningfully compared across provinces.

Don’t miss our newest stories! Follow The 10 and 3 on Facebook or Twitter for the latest news and analysis.

Don't miss our newest maps, charts and stories. Sign up now to have them delivered to your inbox.

Canada Math Team

Canada is Making Noise at the World’s Toughest Math Competition

The International Math Olympiad (IMO), a competition featuring the brightest young mathematical minds from around the world, wrapped up earlier this month in Thailand. The big news was that the US managed to seize the top spot from perennial powerhouse China. Now, without a doubt, Team USA is no slouch — since their last victory in 1994, the Americans have consistently appeared in the top 5, along with other strong performers like Russia and South Korea. But China’s dominance has been absolute, with the country appearing outside of the top two spots just once in the past 28 years, and winning outright in a majority of those occasions.

But look carefully at recent results, and you’ll notice that relative minnow Canada has started to inch its way into the league of top mathematical nations. For years, the Canadian squad performed respectably, if not spectacularly, ranking in the top 30 on a regular basis. That’s not to say that Team Canada hasn’t had any remarkable individual successes over that time. In 2004, 16-year old Jacob Tsimerman achieved a perfect score in the competition, one of only four such perfect examinations in the world that year. In the late 1980s, future Stanford math professor Ravi Vakil earned two straight gold medals, and later became one of the few four-time Putnam Fellows in the university-level Putnam Mathematical Competition. But the structure of the IMO is such that one or two excellent performers in the 6-person team is not sufficient to gain access into the rarefied top 10. The team must be strong as a whole, with few — if any — weak links.

In the past four years, however, Canada has started posting a string of remarkable results, with three top 10 finishes and another in 11th place. So what’s causing this upsurge? Tsimerman, now a professor at the University of Toronto and coach of Canada’s 2015 team, suggests that several factors may be working in Canada’s favour. “Beginning about 8 years ago we began a trend that saw the training camps being run by returning IMO contestants,” Tsimerman notes. “This has had very good results I think, as the past contestants have a better understanding of the material and the students’ mindsets.”

Coaching is certainly part of the equation. But without strong students, your probability of success vanishes. Enter Alex Song. Song, a modest, soft-spoken student who is heading to Princeton University this fall, has been a force of nature for Team Canada. “Alex Song has been on our team 6 times now, winning 5 golds, a perfect score this year, and thus topping the IMO Hall of Fame,” a list of the top Olympiad performers of all time. Song has officially entered math superstar territory. But, as Tsimerman observes, perhaps Song’s most important contribution has been to his fellow team members. “Having good students makes the rest of the team better as well, as he gets to interact with them during the camps and that’s extremely valuable.”

Recent successes aside, the real question is whether Canada can become a permanent fixture among the elite mathematical nations. Tsimerman worries that the recruiting pipeline for strong students may be the biggest roadblock. “The thing to realize about Canada is while we have a fairly big population, our base level contest (the COMC) is only written by about 5,000 high school students. This is something we should actively try to fix … since we draw from such a small pool.” Other countries seem to have the right idea, Tsimerman notes. “The UK has their base level contest written by ~200,000 students, and they have only double our population!” If Canada wants to be a major player at the IMO, the problem is well-defined: scour the country to find and nurture the next generation of mathematical talent.

Don’t miss our newest stories! Follow The 10 and 3 on Facebook or Twitter for the latest news and analysis.

Don't miss our newest maps, charts and stories. Sign up now to have them delivered to your inbox.

Urban Trees

Follow The Data:
Volume 3

Follow The Data is our weekly curated list of cool and unusual data stories from around the country and the world. Got a hot tip on a data story? Let us know on Facebook or Twitter.

The Best and Worst Cities for Women

A new study ranks the best, and worst, cities for women in Canada, basing its ranking on factors such as security, health and economic opportunity. The best place? Victoria, BC. And the most ignominious? Waterloo, Ontario (followed closely by Calgary and Edmonton). [National Post]

Immigrants are Bypassing Cities

New demographic data shows an increasing number of intrepid immigrants are living outside of Canada’s biggest cities. [Globe and Mail]

Are Those Trees Good for You?

A study of 30,000 Toronto residents quantifies just how much living near trees can improve an urban dweller’s health. [Washington Post]

Politics and Pop Culture

An analysis of Facebook Likes shows how your political leanings may predict your favourite movies, books and actors. Most shocking finding? Whether you’re Liberal, Conservative or a Bloc Quebecois voter, you’re partial to Adam Sandler. [CTV News]

The Story Behind that Street Name (in French)

Cool interactive map shows the origin stories of Montreal’s famous (and not so famous) streets. Article in French. [Huffington Post Quebec]

Choose Your Own Adventure — Canadian History Style

This amusing Youtube-based choose-your-own-adventure game released by the Department of Canadian Heritage for Canada’s upcoming 150th birthday is a fun, if light, history lesson about exploration of the Northwest Passage. Some see less fun and more propaganda, however. [Department of Canadian Heritage]

The Draw of the Casino

The story, and map, behind Ontario’s so-called self-excluded gamblers: people with gambling addictions who have volunteered to be arrested if they enter a casino. [Global News]

Immigrant Nation

Which country has the highest percentage of immigrants? Although countries like Canada and the USA certainly justify their reputation as immigrant magnets, it turns out that many small nations have a far higher percentage of foreign-born residents. [Five Thirty Eight]

Don't miss our newest maps, charts and stories. Sign up now to have them delivered to your inbox.

Anthony Bennett

Canada is the Next International Basketball Powerhouse

When Lebron James came home to Cleveland last summer, joining forces with fellow US Men’s basketball team members Kevin Love and Kyrie Irving to form the NBA’s newest version of the “big three,” who knew that a rash of devastating injuries would usher in an unlikely cast of foreign heroes in northeastern Ohio? The towering Russian centre Timofey Mozgov and pugnacious Aussie shooting guard Matthew Dellavedova each stepped into prominent roles, but it was the bruising Canadian forward Tristan Thompson who really introduced himself to the basketball world as an emerging star.

That Thompson hails from Toronto and not New York or LA surprised almost no one who has been paying attention to basketball in recent years: his fellow Canadian ballers have been grabbing the headlines lately. While the youngsters are busy making a lot of noise in March Madness and getting drafted left and right, the pros are becoming major contributors on their NBA teams, and are starting to pick up some serious NBA hardware. It’s no secret now that Canada, once thought of exclusively for its hockey prowess, is the next international basketball powerhouse.

Canada Explodes onto the International Basketball Scene

The ranks of NBA teams have skyrocketed with non-US players in the past decade. A number of factors have been put forward as being the catalyst for all this international talent, including the global reach of Michael Jordan and the 1992 Dream Team, the Hall of Fame careers of NBA champions like German Dirk Nowitzki, Spaniard Pau Gasol and Argentinian Manu Ginobli, and the professionalization of international (particularly European) pro leagues. Whichever ingredients are most responsible for the internationalization of NBA basketball, the results are clear: the number of international players has risen from 28 players appearing in the 1995-96 season to 104 earning minutes in 2014-15 – a 371% jump!


But in the united nations of basketball, no country is better represented than Canada, which featured a remarkable 12 nationals on opening-night rosters in 2014 and another – the 7’5″ Sim Bhullar – joining the Sacramento Kings mid-season.

The legacy of Canadian basketball hero Steve Nash and former Toronto Raptors star Vince Carter seemed to have sparked the flame of Canadian basketball talent. Eleven years after Nash’s Olympic heroics in Sydney and Carter’s jaw-dropping performance in the slam dunk competition, the floodgates of Canadian talent opened to the NBA. At least one Canadian has been drafted in the first round of every NBA draft since 2011: ‘11 (Tristan Thompson, Cory Joseph), ‘12 (Andrew Nicholson), ‘13 (Anthony Bennett, Kelly Olynyk), ‘14 (Andrew Wiggins, Nik Stauskas, Tyler Ennis) and ’15 (Trey Lyles). Both Bennett and Wiggins were the first overall picks, and Wiggins is a potential star-in-the-making after running away with the Rookie of the Year honours. Canadians in the NBA also include veterans Samuel Dalembert and Joel Anthony, as well as Dwight Powell and Robert Sacre. Olivier Hanlan, second round pick in 2015, is working the summer league circuit with the hopes of cracking the Utah Jazz roster.

This is an astounding explosion of Canadian talent compared to the early ‘90s, when the biggest names to represent Canadian basketball were Michael Jordan whipping boy, Bill Wennington, and star of Oz and One Tree Hill, Rick Fox. Things are looking up.


NBA talent translates to international tournament success

After a 15-year absence, Canadian hoops fans are now practically frothing at the mouth for a return to Olympic form. And, for the first time since Steve Nash captained the senior men’s national team, the Canadians are poised to make some noise in international tournaments, starting with this summer’s FIBA Americas Championship, a qualifying tournament for the big one: the 2016 Olympics in Brazil.

Canada is facing a gauntlet of powerful competition, including Argentina, Brazil and Puerto Rico. So, why are hoops fans in the north so optimistic about Canada’s chance to erase the last 15 years of disappointment? Recent history suggests that the presence of NBA-calibre participation bodes well for national teams competing in international tournaments. The second-through-fourth-place-finishing countries in the previous three international tournaments (where the USA took gold) were heavy on NBA talent (current and ex-NBA players):


The 2014 Spanish club, upset by France, featured nine NBA-calibre players and is widely expected to be the USA’s primary threat in the next Olympics.

But Team Canada Coach Jay Triano is working overtime to recruit Joseph, Nicholson, Olynyk, Sacre, Bennett, Powell, Bhullar and Stauskas for the FIBA Americas competition; guard Tyler Ennis would play if he wasn’t recovering from shoulder surgery. Carrying eight NBA players likely puts Canada in the top three for NBA talent brought to qualifiers and that doesn’t include the real possibility that Andrew Wiggins and Tristan Thompson both choose to suit up for the red and white this summer. Add in the recently drafted Trey Lyles and former Knick, Andy Rautins, and the roster is nearly full. This group would certainly represent the most formidable arsenal of basketball weaponry ever sent to an international tournament by Team Canada.

The next generation of Canadian ballers

If the possibility of so much NBA talent germinating the senior men’s team has Canadian fans salivating, then consider the next wave of talented men rising through the ranks of the NBA’s feeder league, the NCAA.

A record 105 Canadians suited up for an NCAA Division 1 basketball team in 2015 and 26 played in the March Madness NCAA Tournament. Highly touted recruit Jamal Murray, from Orangeville, Ontario, recently committed to the University of Kentucky, a titan of college basketball known for turning out high NBA draft picks. Young Xavier Rathan-Mayes, a point guard at Florida State University who hails from Scarborough, Ontario, has been compared favourably with Captain Canada himself. Here in Canada, Carleton University Coach Dave Smart has turned the Carleton University Ravens into a dynasty that can roll with solid D1 NCAA teams. Canada is also competing in younger international divisions, taking an experienced squad to a fifth-place finish in the 2015 FIBA U19 World Championships after finishing a best-ever second place at the 2014 FIBA America U18s and challenging the stalwart Team USA in the FIBA Americas U16 gold medal match, led by 15-year-old phenom, Simi Shittu.

Canadian women’s basketball is ascending as well. The national team placed second in the 2013 FIBA Americas Championship, fifth in the 2014 FIBA World Championship and is preparing to qualify for the 2016 Olympics, this summer.

Basketball’s compass points north

If this talent eruption continues on its current pace, it wouldn’t be surprising to see the number of Canucks in the NBA double before the end of the decade. That means further chances to see more players with Canadian passports selected with the first pick of the NBA draft, win rookie-of-the-year honours, play pivotal roles in the NBA Finals, and maybe, just maybe, compete for that elusive Olympic gold.

Don’t miss our newest stories! Follow The 10 and 3 on Facebook or Twitter for the latest news and analysis.

Don't miss our newest maps, charts and stories. Sign up now to have them delivered to your inbox.

Northern Lights

Follow The Data:
Volume 2

Follow The Data is our weekly curated list of cool and unusual data stories from around the country and the world. Got a hot tip on a data story? Let us know on Facebook or Twitter.

Does the Canadian-Designed Ebola Vaccine Work?

Given the precipitous drop in new Ebola cases in West Africa, it has become extremely difficult — from a statistical perspective — to determine whether a promising Canadian-designed Ebola vaccine even works. Both a good (for the present), and bad (for the future), problem to have. [Macleans]

CRA Makes Paying Taxes Even More Painful

An understaffed Canada Revenue Agency cannot keep up with the demand for phone support, forcing 7 in 10 callers to call back after receiving a busy signal. [National Post]

Forecasting the Northern Lights

Daily-updated map shows the best regions for viewing the Aurora Borealis (happening now!) across Canada and the Northern US. Why does these weather maps all look like they were made in the 80s? [University of Alaska Fairbanks]

How Torontonians Spend Their Money

Toronto Life’s fascinating Cost of Living column, examining how citizens at every income level make and spend their money. [Toronto Life]

Most Trusted Brands in Canada

A touchy-feely collection of comfort foods (Campbell’s Soup, Tim Hortons), Canadian sentimental favourites (Canadian Tire, Canada Post), and international tech behemoths (Google). [Globe and Mail]

Food Insecurity in Nunavut

Heartbreaking profile reveals that 7 in 10 Nunavut preschoolers live in homes that are food-insecure. [The Atlantic]

Mapping Winnipeg’s Urban Development

Useful (but admittedly clunky) map highlights new infrastructure projects around Winnipeg. [Speak Up Winnipeg]

The Elite 8

Forecasting whizzes Five Thirty Eight offer their predictions for the champion of the Women’s World Cup (being played in Canada) from among the eight remaining nations. The favourites? Germany and the USA, each with about a 30% shot. Canada sits in 4th with an 8% chance. [Five Thirty Eight]

Mapping Global Terrorism

Heatmap shows locations of terrorist attacks around the world from the past 30 years. [Google Maps Mania]

Don't miss our newest maps, charts and stories. Sign up now to have them delivered to your inbox.

Canadian Craft Beer

Destined to Go Flat?
The Explosive Growth of Craft Breweries in Ontario and Quebec

Both Ontario and Quebec have been producing beer for centuries – Jean Talon, the first Intendant of New France, commissioned Canada’s first commercial brewery in 1668. In the last thirty years, however, new breweries have been popping up swiftly and an entire craft brewery culture has sprung from the quiet industrial districts of Canada’s cities and into the mainstream. The last three years have seen unprecedented growth in the number of microbreweries in Ontario and Quebec, and today there are 286 of them operating across the two provinces. While the Ontario and Quebec brewing industries have developed in different ways, both are facing fresh challenges brought about by added competition and a changing marketplace, stoking some fears that the explosive growth could lead to a dramatic collapse.

Ontario: New Brewers, Old Problems

Microbrewing in Ontario is a relatively recent phenomenon; brands like Wellington Brewery, Brick Brewing Company, and Great Lakes Brewery began in the mid-1980s, laying the foundation of Ontario’s burgeoning craft brewing scene. The industry has recently turned on its head; of the 167 brewers open in Ontario today, just over half are less than two years old, while two-thirds have yet to see their fourth birthday. Last year especially proved to be a banner year in Ontario, with 47 breweries and brewpubs opening for business in places as far-reaching as Pembroke, Windsor, and Sault Ste. Marie.

  “It’s been way harder to keep up with it all,” says Ontario beer writer Ben Johnson. “Every time there was a new brewery opening, I’d come by to visit. Now it’s just not possible anymore.”

While the nearly weekly grand openings may seem like a boon for beer lovers, old regulatory constraints continue to hamper the development of brewers’ supply chains, and frequently a new brewer’s products will only reach a handful of consumers.

Ontario brewers are beholden to complex distribution regulations; only three avenues exist for getting their suds into the hands of thirsty beer drinkers. They can choose to pay an expensive listing fee at The Beer Store, navigate a byzantine bureaucracy to reserve shelf space at the LCBO, or work on a person-to-person basis, selling beer directly to bars and restaurants. Most brewers, once they’ve developed a strong customer base and have ramped up production, will combine all three routes.

“Market saturation is a big problem,” beer historian and author Jordan St. John says. “In Ontario, the LCBO doesn’t have the shelf space to deal with beer, so it always comes down to the preference of the buyers at the LCBO. So, the people who understand bureaucracy have a working relationship with the LCBO.”

As it can be expensive and time-consuming to get a brewer’s earliest batches to market in Ontario, it has become common for brewers to turn to ‘contract brewing,’ a system where breweries opt not to set up a brick-and-mortar factory themselves, and instead pay other breweries to produce their beer for them. These breweries typically only produce one or two styles of beer, and primarily focus on sales directly within their immediate region to local restaurants or nearby LCBOs.

By our count, there are presently 42 contract breweries in Ontario, ranging from two-month old newcomer Bobcaygeon Brewery to the more established Kensington Brewery, which has been attempting to open its own Toronto facility for the past two years. Contract brewers usually do not stay contract brewers for long; the goal is that, once they present strong sales numbers, they begin to move into their own purpose-built brewery, as Toronto’s Left Field Brewery accomplished last year.

“[Contract brewing] has greatly increased the number of brewers that can call themselves brewers now,” Johnson says. “There’s just been kind of a bandwagon situation. I think we’re going to see a huge number of brewers disappearing in the next little while.”

On its own, contract brewing can only explain some of the tremendous growth in the number of Ontario breweries. Another major factor is the proliferation of small microbreweries outside of major cities. While Toronto, Kitchener and Ottawa have been involved with craft beer for decades, small towns are increasingly joining the trend. Some rural towns have become thickly populated by breweries – Collingwood, with a population of only 20,000, currently supports three production breweries, including Collingwood Brewery, which recently won two Canadian Brewing Awards.

“The reason why you have breweries starting up in smaller towns is because they are trying to sell to nearby bars, which is more practical,” St. John says. “You’ve got less ambitious strategies – people are looking to carve out smaller niches for themselves.”

As a result, many of these new breweries, stuck with the old regulations preventing their product from being sold on the open market, produce beer that may never make it into the hands of most Ontario beer drinkers. To date, 78 breweries (46% of the province’s total) are outside of Ontario’s 5 major population centres (Toronto, Hamilton, Ottawa, London, and Kitchener-Waterloo). With the exception of some breweries based in Guelph, Niagara, and parts of Eastern Ontario, many of these small-town breweries have very modest production capacities.

“The thing you’ve got to remember is that startup breweries are not making a lot of beer,” St. John says. “One of the predictors I use to see if these brewers are going to last another five years is if they talk about money. The people who talk about passion are screwed. The danger of craft beer evangelism is that it’s not what it’s about.”

St. John uses the example of Left Field’s new Toronto facility. Once it reaches its full production capacity, it will house a 26 hectolitre system, which is a drop in the bucket compared to the 19 million hectolitres of beer sold in Canada in 2013, according to Beer Canada, a trade organization that collects statistics on the industry.

As a result, though many new breweries have recently opened their doors, they haven’t flooded the market with beer, and some have struggled to grow the kind of customer base necessary to ensure long term success. Their sales, marketing, and overall quality will most dictate their survival in this brave new world. For example, Stock Pot Ales, a nanobrewery based in the renowned Wellington Gastropub in Ottawa, quietly ceased operations in February, despite putting out over 10 different beers and collaborating on beers with other, well-known local breweries.

“If you look at the numbers, it’s essentially a classic bubble pattern,” St. John adds. “I’m totally happy to see angel investors putting money in existing breweries, but the idea that you can walk in off the street and start doing it, it’s not true.”

Quebec: Old Brewers, New Problems

Although Ontario and Quebec are neighbours, stiff importation laws put in place by both provincial governments long prevented most beer from being shared across provincial lines, and as a result, the two industries have developed quite independently from one another. Quebec has became known as the home of some of the finest brewers of Belgian-style beer in North America. Quebecois brewers have used their francophone heritage to pore through Belgian textbooks on brewing and malting, and the result has been some very true-to-style Belgian ales, like Charlevoix’s Dominus Vobiscum line. But driven by fierce competition, the industry has recently become known just as much for its innovation and variety as for its respect for traditional Belgian brewing.

As in Ontario, Quebec’s craft brewing scene started modestly in the 1980s. But unlike Ontario, which has seen a huge brewery spike in the past several years, Quebec has experienced relatively constant growth over the past two decades. On average, about four breweries open every year in Quebec, while the most breweries to open in a single year was 14, in 2012. At present, 119 breweries are operating in the province, and virtually none of them are listed as contract brewers.

In Ontario, regulations only permit a few points of sale; but without a wholesaling board like The Beer Store or the LCBO in control, Quebec breweries are free to sell their beers in convenience and grocery stores across the province. Once the proper certifications and permits are in place, there are few regulations surrounding whom brewers can sell their wares to.

“There was a big development in [the success of the] specialized dépanneur,” says Alain Geoffroy, co-owner of Gatineau-based Les Brasseurs du Temps and long-time advocate for Quebec craft beer. “It’s a convenience store where you won’t find milk, but you will find 200 brands of beer!”

Furthermore, with entrenched distribution networks throughout Quebec, many microbreweries are able to sell their products easily across the province for little added cost. For example, Microbrasserie À l’Abri de la Tempête, located on the tiny Îles de la Madeleine archipelago off the coast of Prince Edward Island, is able to successfully sell its beer to customers as far away as Gatineau and Montréal.

But despite fewer total breweries and looser regulations than in Ontario, Quebec breweries face a much more heated competition for the thirsty masses, with 18% more breweries per capita than their neighbours to the west. And while Ontario breweries scramble for every square inch of shelf space at the province’s few points of sale, Quebec breweries must compete on the product itself, and often experiment with new beer styles to distinguish themselves. Unsurprisingly, it’s often the newer, scrappier breweries that are known to try their luck in this fierce market with less mainstream beer styles such as sour ales, wild yeast beers, and blended beers.

“The longstanding microbrewers, the big names like McAuslan and Charlevoix, they’re built on solid ground and these brands work well,” says Geoffroy. “The funkiness and the new things that will keep the consumers excited come from the newer breweries.”

Other breweries have made an effort to specialize in certain styles and build their brands that way, such as Microbrasserie Le Castor, a Rigaud brewery that made a name for itself almost exclusively on its IPA-style beers.

“People are really more interested in quality,” says Geoffroy. “It shows in the market right now that the strongest, fastest-growing microbreweries are focusing on just that.”

With brewers focusing on increasing the variety and quality of their offerings, consumers seem to be the biggest winners, while the innovation is creating exciting new directions for breweries to go.

“We’re in a bit of competition now,” adds Geoffroy, “but it’s not bad, and brewers are cool people, working by passion, and not to make money. At a certain point though, they have to make money. It’s a bit taboo right now, but eventually we’re going to have to talk about the competition.”

In this competition for the consumer’s tastes, some breweries start with much fanfare and then fizzle out, like Laval’s AMB Maître Brasseur in 2011.

“It’s always sad to hear of a brewery closing down,” says Geoffroy. “The first reaction is to find out what happened, and to see if we can avoid their errors.”

Even though Ontario and Quebec are both awash in more craft beer than ever before, the future remains quite uncertain for newly-christened microbrewers. Ontario is moving towards shedding some of its regulations, most notably allowing for beer sales in grocery stores. Meanwhile, momentum in Quebec is building to create a Quebec brewer’s quality alliance, with the goal of building more demand for the members’ beers while maintaining consistent standards for brewers throughout the province.

If these problems can be remedied, we could one day see Ontario and Quebec’s craft beer become as well-known and respected as American craft beer. If not, then all those cool new neighbourhood breweries you recently heard about just may not be around much longer.

Don’t miss our newest stories! Follow The 10 and 3 on Facebook or Twitter for the latest news and analysis.

Don't miss our newest maps, charts and stories. Sign up now to have them delivered to your inbox.

Chicago Blackhawks Stanley Cup Winners

Follow The Data:
Volume 1

Follow The Data is our weekly curated list of cool and unusual data stories from around the country and the world. Got a hot tip on a data story? Let us know on Facebook or Twitter.

Scoring on Canada’s World Cup Artificial Turf

Despite all the hand-wringing over the Canadian Soccer Association’s decision to use artificial turf for the Women’s World Cup, these graphs show that goal scoring hasn’t really been affected. [Business Insider]

If This Voting System Doesn’t Work for You, Try Another

The CBC lays out the pros and cons of the first-past-the-post voting system, which Liberal leader Justin Trudeau has proposed abolishing. One popular alternative: proportional representation (but get ready for the painful horse-trading required to build a coalition). [CBC]

The Blackhawks are a Dynasty

A look at historical championship data across the 4 major sports leagues shows that, yes, the Blackhawks are indeed the first salary-cap era dynasty. [Five Thirty Eight]

The Demographic Explosion of Richmond, BC

Demographic data suggests that Richmond, BC, may be the most hyper-diverse city on the planet, with over 60% of its residents being foreign born. [Vancouver Sun]

Lightning Danger Map!

Worried about being hit by lightning in the next 10 minutes? Environment Canada now has a colour-coded map for that. Just hope you’re near a computer. [Global News]

Auditing the Auditors

John Oliver mocks the Senate expense scandal, noting that the audit, which revealed up to $1M in inappropriate expenses, somehow cost over $20M to conduct. [Youtube/Last Week Tonight]

Gender Inequality in the Sciences

Despite more and more women graduating with STEM degrees, the data is quite conclusive: the percentage of women working in STEM fields in Canada — and how much they’re paid — has barely budged in the last 20 years. [Macleans]

Lyme Disease on the Rise

Experts suggest cases of Lyme Disease in Canada to rise a remarkable (and suspiciously high) 1900% in just 5 years, from 500 cases a year today to over 10,000 by 2020. [CTV News]

Libraries Paying $135 for That E-Book You Borrowed

New data released by the Toronto Public Library reveals that libraries are paying up to 5 times more for an e-book than is charged to the retail consumer. [Toronto Star]

Don't miss our newest maps, charts and stories. Sign up now to have them delivered to your inbox.

Sad Cleveland Browns Fans

Sports Misery: The New York Times Is Late To The Party

In April, we released our inaugural sports misery rankings, with the goal of quantifying the pain and heartbreak experienced by fans in North America’s most hard-luck pro sports cities. We crowned Cleveland — the city that hasn’t tasted championship glory in over 50 years — the victor, followed closely by that melting pot of misery, Toronto. Fans in Cleveland took the news in stride, knowing all too well that they deserve these dubious honours, while fans in Toronto bemoaned the fact that they couldn’t even win when it came to a ranking of the biggest losers.

So we were surprised last week to see the New York Times’ Upshot blog release its own eerily similar rankings of the most “cursed” sports cities in America. Sure, the format of the piece looks like ours, along with the imagery of fans’ heads draped shamefully in paper bags; the methodology section and metrics sounds a lot like ours too, and the language sounds disturbingly familiar (“we’re looking at you, Buffalo”). And they even came to the same conclusion mere months after we did: Cleveland is the worst!

But hey, we’re not ones to see conspiracy theories in coincidences (The Upshot talks about curses, not misery, after all!). So let’s dig into the rankings and see where and why they differ.

Who to Include?

In our ranking, we looked at all cities in North America with at least three pro sports teams in the big 4 leagues (NBA, NFL, NHL and MLB). This means, in particular, that we considered Toronto, which truly has some of the most miserable fans on Earth: the Raptors haven’t won a playoff series in 14 years, the Blue Jays have the longest playoff drought in any sport, and the Maple Leafs are one of the most dysfunctional franchises to ever exist. Toronto teams compete in the same leagues and are similar in every way to their American counterparts except for the anthem sung before games. The Upshot chose to look only at cities in the USA, because, well, America.

We also included some distinct fan bases from large cities that have many pro teams, like New York, Los Angeles and San Francisco. This allowed us, for example, to appreciate the grinding misery of fans of New York’s so-called “Little Brother” teams — the Mets, Jets and Islanders — who are linked by historical ties to Queens and Long Island, and a history of losing.

On the other hand, The Upshot decided to include cities that have just two major sports franchises, meaning sad-sack fans from places like Buffalo, Cincinnati and San Diego could be properly recognized for their years of hardship. While many of these championship-starved cities have definitely had a tough run in the past 30 years, we made the difficult decision to omit these from our rankings. It’s not that unlikely for two teams from one city to both be bad — that’s actually quite common. It’s only when a city has three or more such underperforming teams that people really start whispering about a sports curse (think Cleveland, or Boston before the 2000s).

Ranking Differences

Rank

The 10 and 3

NY Times

1 Cleveland Cleveland
2 Toronto Atlanta
3 NYC (Queens-Long Island) Buffalo
4 Houston San Diego
5 Minneapolis Washington, DC
6 Atlanta Minneapolis
7 Oakland Philadelphia
8 Miami Phoenix
9 Washington, DC Oakland
10 Philadelphia Kansas City

After Cleveland, our ranking disagrees with the Upshot’s for a few key cities, primarily because the Upshot’s metric focuses heavily on championships, while we consider the whole picture of a team’s success — playoff appearances and playoff wins — in addition to championships. The Upshot is really bearish on Atlanta, for example, ranking them in 2nd among cursed cities, while we drop Atlanta to 6th. Sure, Atlanta franchises have not won too many championships, but the Falcons, Braves and Hawks actually make the post-season on a regular basis, giving fans quite a bit to cheer for. Championships alone don’t tell the whole story.

On the other hand, the Upshot is considerably more bullish on Houston (11th place) than we are (4th place). Houston sportswriting pundits agree with us that despite some success in the 80s and early 90s, the past two decades have provided nothing but disappointment for H-town fans: the Rockets have moved past the first playoff round just twice in the past 18 years, while the Astros and Texans are rather hopeless, year after year. Similarly, Miami (which we rank 8th) doesn’t even merit an honourable mention by the Upshot. Despite the Heat’s NBA championship in 2013, their remaining teams — the Dolphins, Marlins and Panthers — each haven’t won a playoff series in at least 12 years. That’s a remarkably poor track record for the city’s franchises, and the Heat aren’t looking too promising themselves after Lebron took his talents back to northeastern Ohio.

Which Ranking Do You Prefer?

Let us know what you think, on Facebook, Twitter, or in the comments section below.

Don't miss our newest maps, charts and stories. Sign up now to have them delivered to your inbox.

Canadian Beer

Beer, Wine and Spirits: How Much Do Canadians Spend on Alcohol?

A recent study in the journal Addiction revealed that the average Canadian drinks 50% more alcohol per year than the average world citizen. Surprised? Neither were we. Anyone who has lived through a long, cold Canadian winter knows that Canucks can more than hold their own against international drinking heavyweights like the Russians and Germans. But a look at the provincial data shows that not all Canadians show a similar fervour for beer, wine and spirits. So which regions are bringing up the average, and which consume more moderately?

Link to Alcohol Consumption in Canada Chart

The Heavy Drinkers

The stereotype goes that when you don’t have much to do for fun, or when your economic opportunities are limited, you drink. The data bears this out. Canadians living in areas with few recreational opportunities often pass their time with a comforting alcoholic beverage. Just on beer alone, residents of Yukon spend a shocking $608 per person each year, while those in the Northwest Territories follow closely at $607. That’s about the cost of a fancy new smartphone, or four new winter tires for your pickup truck, and it’s almost double what the average Canadian spends on beer every year.

But is this disparity simply due to higher prices in the north? Not at all. A two-four of Molson Canadian cans costs $40.55 in the Yukon, roughly the Canadian average (Manitoba tends to have the highest prices for this category of beer). Far down in third place — but certainly not a province to be trifled with — is Newfoundland and Labrador, which clocks in at an average $517 of beer per person. While beer in this province is indeed slightly more expensive on average than in the rest of Canada, it’s clearly volume — not price — that accounts for Newfoundland’s impressive showing.

If you look at spirits, the story is roughly the same. The Northwest Territories leads the pack with an immense annual spend of $548, followed by fellow northerners in the Yukon ($313), and our familiar thirsty easterners Newfoundland and Labrador ($280). Once again, price does not explain the disparity: spirits cost roughly the same across Canada (at least if you are looking at big brands such as Jack Daniel’s whiskey and Smirnoff vodka).

A different narrative emerges when we examine wine. In this category, Quebec is the clear frontrunner. Given their Gallic roots, it hardly comes as a surprise that they would favour a more civilized beverage, with Les Quebecois spending $320 annually per person. But giving Quebec a run for its money is British Columbia ($246), with its emerging reputation as one of Canada’s winemaking powerhouses, particularly in the Okanagan Valley.

Thirsty in the North

The data could not be more clear – the people of the north like to drink. On average, residents of Yukon and the Northwest Territories spend over $1000 per year on beer, spirits and wine, easily outpacing all other provinces and almost doubling the Canadian average. While theories abound for this large disparity, the territories are certainly known for their “frontier alcohol culture”. According to the Northern Review, after alcohol began to arrive in northern Canada in the eighteenth century, a binge drinking style soon became commonplace among many of the native people, historically related to the tradition of feasting during times of plenty. As access to alcohol increased in the 1950s, drinking culture became pervasive and as the data suggest, it has not died down. The sheer isolation (a density of less than 0.1 people per square kilometre) and frigid temperatures (average annual temperatures around freezing in the warmest locations) are likely significant contributing factors to the north’s tradition of finding solace in the drink.

Nunavut is an interesting case. Alcohol is completely banned in much of the territory, and in other areas, is accessible only at a small number of licensed restaurants or via a byzantine and heavily regulated order-by-mail process. This accounts for the low official numbers we observe for Nunavut (just $218 per person annually). On the other hand, Nunavut has a well-documented problem of binge drinking and alcoholism, with much of the alcohol procured unofficially through a network of bootleggers. This may all be shaken up soon, as leaders are currently debating whether to open the territory’s first liquor store.

The (Relative) Teetotalers

Beer is clearly the drink of choice in Canada, outselling both wine and spirits in every province and territory of this country. But at the bottom of the beer-swilling list (excluding Nunavut) is Ontario, whose residents spend just under $300 per person on suds.

On the other hand, some Canadian provinces simply don’t have the palate for wine and spirits. Residents of Saskatchewan thumb their noses at wine culture, consuming just $92 of the beverage each year (likely due in part to the paucity of Saskatchewan wineries). And if you are a spirit-lover in Quebec, you may be a little lonesome. Residents there spend the least each year on the hard stuff.

So besides Nunavut and its unusual circumstances, who takes the national championship for the lowest consumption of alcohol? Prince Edward Island just edges out neighbour New Brunswick for the title. PEI, which held on to its prohibition laws until 1948 — almost 20 years after the rest of the country had given up — appears to still retain something of its puritanical streak. But despite Islanders spending the least overall on booze, alcohol-related struggles still plague the province, with a high rate of binge drinking and surprising rates of fetal alcohol syndrome stressing the province’s health care system.

Methodology

Provincial spending data comes from Statistics Canada’s 2014 figures on the sales of alcoholic beverages per capita for residents 15 and older. In addition to sales of beer, wine and spirits, Statistics Canada reports sales of CCORB (ciders, coolers and other refreshment beverages), which we group together with beer in this article. We collected alcohol prices in each province for a set of popular brands: Molson Canadian 24 cans and bottles, Smirnoff vodka and Jack Daniel’s whiskey.

Don't miss our newest maps, charts and stories. Sign up now to have them delivered to your inbox.

Alberta Oil Sands

Searching Canada: What Baffles Canadians Most About Their Homeland?

Google’s Autocomplete feature was born with the purpose of making search a little bit faster, and maybe a little bit more fun. Type in a few words or even just a character or two, and Google will suggest the most common completions of that query. Sure, it can save you a few keystrokes when you’re looking for the name of that nearby burrito shop. But isn’t the real point of this crowd-sourced sociological treasure trove to discover what weird and wonderful things people are searching for?

This article is the first in our Searching Canada series where we explore public search data to understand what Canadians really think about their country, their city, and themselves. Today, we tackle the question of what baffles Canadians most about their provinces and cities, by offering Google the prompt “Why does [place name]” and seeing what Autocomplete tells us most users type next.

Searching Canada: What Baffles Canadians Most About their Homeland

So what vexes Canadians most about their provinces and cities? For many places, it’s the weather and local geological phenomena (Alberta, PEI, Yukon); for others, it’s the fear of separation (Quebec, Newfoundland and Northwest Territories); and still others, it’s the sometimes bizarre quirks of a place that can befuddle even long-time residents (Saskatchewan and Ontario).

Weather and Geology

Canada is rightly known for its magnificent physical beauty, vast territory and remarkable climate diversity, and Canadians are hitting their keyboards to better understand the natural mysteries of their land. For instance, Canadians are curious why Alberta (“have so much oil”) possesses the giant (and environmentally controversial) oil sands in the northeast of the province, and why the Yukon (“have gold”) contained a wealth so vast that it triggered the Klondike Gold Rush at the end of the 19th century. Prince Edward Island (“have red sand”) is home to the signature red-tinted beaches – caused by the high iron-oxide content in the sandstone bedrock – while Manitoba (“flood”) is burdened with surge-prone rivers like the Assiniboine near Brandon and the Red River near Winnipeg.

Some Canadian cities are known for their weather quirks, too. Easterners likely wonder why Vancouver (“have mild winters”) is blessed with pleasant temperatures all year round, while everyone outside Alberta is trying to figure out what those unique warm winter winds in Calgary (“get chinooks”) are all about. Most of Canada is not particularly known for its seismic activity, so searchers are often curious why Ottawa (“get earthquakes”) tends to experience moderate tremors (like the 5.0 quake in 2010) from time to time.

Separation

It is perhaps no surprise that searches about Quebec (“want independence”) focus on the province’s decades-long quest to separate from Canada. But apparently Canadians are also looking to Google to understand whether Newfoundland (“want to separate”) has an independence movement of its own. The Northwest Territories (“split”) is a big place, but we all know that it used to be bigger. On April 1, 1999, the territory of Nunavut was carved off of its eastern half; many Canadians are apparently still trying to figure out why.

The Oddities

Most Canadian provinces celebrate a statutory holiday called Family Day, occurring on the 3rd Monday of February. British Columbia (“have a different Family Day”) decided to forge its own path by celebrating it instead on the 2nd Monday of February. Canadian searchers are rightly scratching their heads about that one.

In another stumper, most of Saskatchewan (“not change time”) has decided to go it alone by sticking with Daylight Savings Time year round. While this strategy may offer the advantage of not needing to change clocks twice a year, things may get a little bit confusing if you find yourself traveling for a 9am appointment in the city of Lloydminster, the only place in Saskatchewan that does adjust its clocks.

Finally, Canadians use Google to gain insight into what is perhaps the deepest mystery of all: why Ontarians drink milk stored in bags rather than in cartons or jugs. This popular instructional video explains the complex mechanics (and accessories) required to simply pour yourself a glass.

Methodology

For most locations on our map, we simply used the first autocomplete suggestion after “Why does [place name]“. However, in a few cases, we picked an autocompletion from further down the list if it was particularly unique or representative of that place, and also substituted common contractions (like BC for British Columbia) to solicit more representative completions. Note that for New Brunswick and Northwest Territories, autocomplete changes the search term does to did on its own, and so suggests a historical event.

All of our searches were conducted on www.google.ca, but note that Autocomplete can vary by place and time, so not all of our results may be reproducible where (and when) you are.

Don't miss our newest maps, charts and stories. Sign up now to have them delivered to your inbox.

Canadian Immigrants

Mapping Canada’s Mosaic of Immigrant Communities

Canada’s multicultural mosaic has produced a dazzling array of immigrant enclaves throughout the country. You’ve certainly heard of Vancouver’s Chinatown, guarded by the towering Millenium Gate on Pender Street and home to Canada’s largest Chinese population. And Montreal could not truly be La Belle Ville without its Little Italy, centred around the grand, fresco-laden Church of the Madonna della Difesa and the bustling Jean-Talon public market.

But how about Toronto’s vibrant Little Jamaica, known for its jerk chicken street BBQs and famous barbershops? Or Laval’s growing Little Lebanon, which is increasingly drawing Arabic-speaking immigrants away from St. Laurent in neighbouring Montreal?

Canadian Immigrants Map

To visualize Canada’s remarkable immigrant diversity, we put together an interactive map that displays which immigrant group is most populous in different parts of the country. We divided the country into census divisions, and used data from the 2011 National Household Survey to find the most common country of origin in each region.

In our previous language map, we looked at the dominant tongues spoken throughout the country, but that map told only some of the astonishing story of Canadian multiculturalism. For instance, the Spanish-speaking regions in Quebec hide the fascinating diversity of Central and South American arrivals in that province, while French-speaking regions can include immigrants from former French colonies and mandates like Haiti and Lebanon in addition to native Quebecois. English speaking regions hide the rich tapestry of immigrants from the West Indies, the US and UK. Finally, northern regions dominated by speakers of Aboriginal languages are also home to an array of intrepid immigrants from some rather surprising places.

We provide two versions of the map: one that excludes immigrants from the US, UK and France (countries which are among the highest sources of immigrants to Canada, but whose cultural and linguistic similarities to Canada make them somewhat less intriguing to study here), and one that includes these groups.

There are many interesting stories to tell in this map, but below we highlight a few of the most fascinating.

Montreal’s Growing Diversity

While Toronto usually grabs the headlines as Canada’s most diverse city, Montreal is fast becoming a remarkably cosmopolitan place itself, with a third of the city’s population born outside the country. Within the city limits, immigrants from Italy form the largest group of foreign-born Montrealers. Add in another 200,000 residents of Greater Montreal with Italian ancestry, and you get Canada’s second biggest Italian community (only Toronto’s is larger). Centred around a beautiful stretch of St. Laurent Boulevard, Little Italy is famous for its quaint shopping, remarkable variety of authentic Italian cuisine, and the nearby Jean-Talon farmer’s market. Recently, Montreal’s growing pains bubbled to the surface when Quebec’s notoriously zealous “language police” demanded that restaurateurs provide French translations for menu items like pasta and calamari (but not, it should be noted, pizza). After a public outcry, the request was quickly rescinded, but the incident revealed the delicate balance that Quebec faces between maintaining its French heritage while still welcoming a diverse group of newcomers.

On the other hand, several of Montreal’s largest immigrant groups do come from former French colonies and mandates, so adapting to local language customs is not as formidable a challenge. Though just barely outnumbered by Italians in the city of Montreal, Haitian immigrants form the dominant immigrant group in several neighboring towns including Terrebonne and Repentigny. Haitian immigration to Quebec has skyrocketed in the past 10 years, particularly after the devastating 2010 earthquake which sent thousands of Haitians to search for new homes outside of their native land. The tenure of journalist Michaëlle Jean as Canada’s Governor General further enhanced the profile of this growing, vibrant community.

Montreal’s Lebanese community — much of which is French-speaking — has started to outgrow its former stronghold in the St. Laurent neighborhood. Instead, families are starting to move north to Laval, where Lebanese Canadians already form the largest immigrant group. With turmoil raging in the Middle East, newcomers from other Arab nations like Syria and Egypt have followed their lead and settled in Laval.

Finally, as we saw in the language map, Spanish speakers have flooded into Greater Montreal and other parts of southern Quebec. It may come as a surprise, however, that the dominant Spanish-speaking immigrant group in the province is not from Mexico (as in most of the rest of Canada), but rather from Colombia. The cities of Drummondville, Sherbrooke, Trois Rivières and Quebec City all boast sizable Colombian populations, and the provincial government continues to seek out skilled Colombian immigrants to make their way to Quebec.

Toronto: The Most Multicultural City in the World?

The city of Toronto is without a doubt Canada’s crown jewel of multiculturalism. Residents speak over 140 languages and dialects, and remarkably, over half of the population is foreign born. Rivaling London and New York for the title of most diverse city in the world, Toronto features a dizzying array of well-known ethnic enclaves like Portugal Village, Greektown, Little India, Little Italy, and huge communities of Jewish, Filipino, Sri Lankan and West Indian residents. But by far the biggest immigrant group comes from China, with over 130K Chinese immigrants in the city itself and another 65K to the north in York region. Across the entire Toronto metropolitan region, almost 600K residents identify as being of Chinese origin.

To the east of Toronto in Durham Region, the largest group of immigrants (besides those from the UK) come from Jamaica. Although the Eglinton West neighborhood in Toronto has come to be known as Little Jamaica (along with additional West Indies influence from Barbadian, Guyanese and Trinidadian residents), towns like Pickering, Ajax and Oshawa in Durham Region feature vibrant Jamaican communities that maintain strong bonds with their cultural heritage.

To the west of Toronto, in suburban cities like Mississauga and especially Brampton, immigrants from India have settled in extraordinary numbers (over 150K are foreign born). Over two-thirds of the region’s population is classified as a visible minority, and the influx of new arrivals has happened so quickly that the region is going through something of an identity crisis. Everything from city planning, healthcare and even policing is undergoing a sea change.

Looking further to the south and west into more rural areas of Ontario, older European immigrant communities still thrive in places like Brantford (Polish), Huron County (Dutch), Kitchener-Waterloo (Portuguese and German) and the Niagara Region (Italian).

The Rise of the Philippines

Although the Philippines is just the third largest country of origin for immigrants from Asia (behind India and China), intrepid Filipino arrivals – who now number almost half a million – have spread all throughout the far reaches of Canada, developing sizable communities in a remarkably diverse set of places.

Winnipeg houses the oldest significant Filipino community in the country. The government of Manitoba continues to recruit highly-skilled Filipino immigrants, signing an agreement with Manila in 2008 to streamline the immigration process while remaining one of the only provinces in the country to offer a family stream in the provincial nominee program (which doesn’t require new arrivals to have an existing job offer before settling there). Filipinos have also not hesitated to venture into Manitoba’s more rural areas, enticed by the province’s aggressive recruitment of foreign nurses and other initiatives that ensure highly skilled arrivals can continue to work in their own profession rather than through the live-in caregiver program that is common in other provinces.

Filipino immigrants also dominate the other major cities in the Prairies, including Calgary, Edmonton, Saskatoon and Regina. But perhaps the most surprising destination for a group whose homeland is decidedly tropical, is Canada’s Far North. With sizable communities in Whitehorse and Yellowknife (as well as pockets in more remote Arctic destinations), Filipinos have been drawn by the booming service industry in the region, which has allowed them to send substantial remittances back home to the Philippines.

The Big 3: The US, UK and France

It comes as no surprise that some of the largest cohorts of immigrants to Canada come from countries with which Canada shares significant cultural, linguistic and political ties. Over half a million Canadian residents were born in the UK, and these British arrivals have spread in sizable numbers throughout most of the country, except perhaps in Quebec. In that province, immigrants from France — who number over 90K — reign supreme, forming a plurality of immigrants in most of Quebec except in Greater Montreal and other regions close to the American border. Besides the familiar language, French citizens are increasingly drawn by the relatively friendly business environment and rich cultural life of La Belle Province.

Finally, there are over a quarter of a million residents of Canada born in the United States, and like their British counterparts, they too have settled in sizable numbers throughout most of the English-speaking provinces. However, their presence is particularly notable in regions bordering the northeastern states of Vermont, New Hampshire and Maine. Wooed by Canada’s strong economy, national healthcare system and perception as a peaceful and idyllic destination, Americans continue to stream north at a steady (if unspectacular) rate of several thousand per year.

Which regions are you most surprised by? Follow us on Facebook or Twitter and join the discussion.

Don't miss our newest maps, charts and stories. Sign up now to have them delivered to your inbox.