
In the run-up to the federal election in Canada, the niqab issue — whether a woman should be required to remove the face-covering garment when swearing the citizenship oath — has taken centre stage. Along with an alarming flurry of alleged hate crimes committed against Muslims in the past few months, there have been claims of a rising tide of Islamophobia in the country. But when accounting for population, a closer look at the numbers suggests a rather different narrative: despite the real and worrisome rise in hate crimes toward Muslims, two other minority groups are far more likely — by an order of magnitude — to be the victim of a hate crime.
Jewish Canadians, remarkably, are more than 10 times as likely to be the victim of a hate crime than Muslim Canadians, while black Canadians are more than 14 times as likely to be victimized than the average Canadian (and three times as likely as the next highest race or ethnicity tracked by StatsCan). By any reasonable reading of the data, these are profoundly concerning figures.
What is a hate crime?
StatsCan, which collects hate crime data from the country’s police services, defines a hate crime as “a criminal offence committed against a person or property, where there is evidence that the offence was motivated by hate” based on race, ethnicity, religion, gender, sexual orientation or other protected classes. These crimes come in a variety of forms, with approximately 60% of reported hate crimes in Canada being non-violent crimes such as mischief or public incitement of hatred, while the remaining hate crimes are violent, which include offenses like assault, uttering threats, and criminal harassment.
The numbers
We looked at the number of hate crimes reported over the three-year period 2011-2013 (the most recent data available), and calculated how likely it is that people of various groups will be victimized. This per capita approach helps understand the dangers that any individual in a particular group may face.
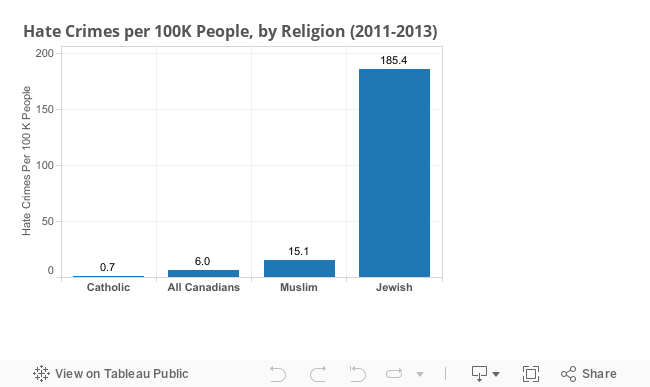

Looking across all Canadians, there were a modest 6.0 hate crime incidents per 100K people over this three-year period. This rate is low enough that most folks will fortunately never experience a crime of this kind, and is approximately the probability of being struck by lightning over a lifetime. But what about particular religious minorities? Muslim Canadians, for instance, suffered 15.1 incidents per 100K people in this time period. This jump indeed seems rather worrisome, particularly in the context of the niqab debate and the recent spate of incidents, until you consider that Jewish Canadians were the victims of 185.4 incidents per 100K people. That’s more than 12x higher, and makes Jewish Canadians far and away the most targeted minority religious group in Canada per capita. When restricting only to violent offenses, the ratio is still high, but narrows somewhat to a factor 6x higher.
B’nai Brith Canada, which tracks antisemitic incidents in the country, sees no letdown in the pace of such crimes, noting in a statement that “2014 was the worst year that we’ve recorded since we began [tracking] in 1982, with a 28% increase over the numbers from 2013.” While Europe has increasingly become a hotspot for virulent antisemitism, the data suggests that Canada is clearly not immune. “This means that the Jewish community is not only disproportionately targeted, but also that antisemitism is a growing problem in Canada.”
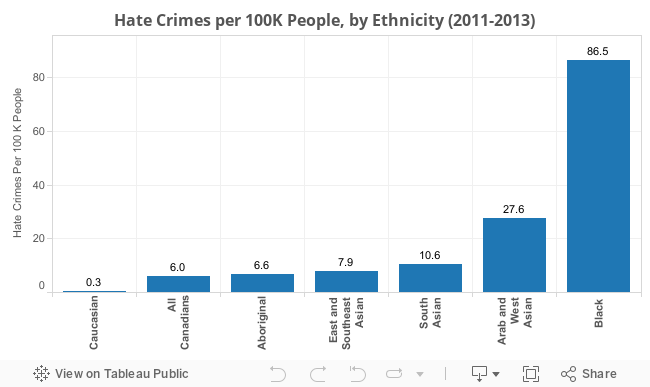
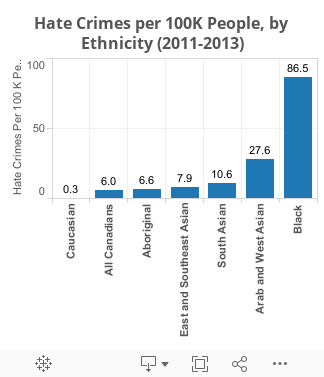
How about racial and ethnic minorities? Black Canadians suffered 86.5 incidents of hate crime per 100K residents over this time period, at least threefold more than all other racial and ethnic groups that StatsCan tracks, including Arabs/West Asians (27.6 per 100K), South Asians (10.6 per 100K), and Aboriginals (6.6 per 100K). And while the United States continues a painful and fraught debate over race relations and hate crime, in Canada this discussion appears altogether muted, particularly with respect to black Canadians. In light of these numbers, perhaps this needs to change.
Methodology
Statistics Canada’s hate crime data from 2013 is available here. Hate crime data from 2011 and 2012 was provided to The 10 and 3 by Statistics Canada via email. Population data was taken from the 2011 census.
To be sure, Statistics Canada’s data under reports the frequency of hate crimes; not all hate crimes are reported to police, and not all crimes that are motivated by hate are properly classified by the police (or victims) as such. Moreover, certain populations may be more or less willing to report hate crimes to the police, although there is no evidence to suggest whether and how much the data for any particular group is skewed by this issue. Finally, it’s important to remember that while some instances of hate crimes may target an individual (an assault, for example), other instances may target an entire group (hate graffiti).
Don’t miss our newest stories! Follow The 10 and 3 on Facebook or Twitter for the latest news and analysis.