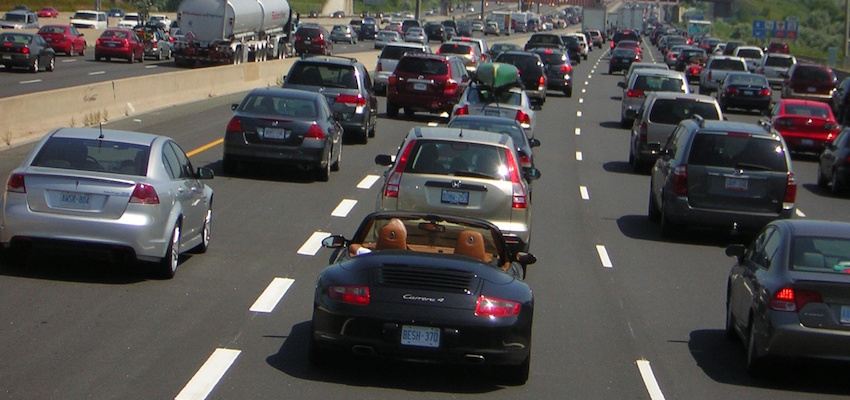
Traffic is bad and getting worse in cities across Canada. A recent study study suggested that the average Canadian commuter lost a mind-boggling 79 hours to traffic in 2014, an increase of two hours from the previous year.
But not every commute is created equal. While drivers traveling across Edmonton or Winnipeg may face some unpleasant congestion during busier times, their pain pales in comparison to the horror of the country’s most daunting commutes. Drivers heading to downtown Toronto along the overburdened Don Valley Parkway from the dense northern suburbs have learned to face the daily 14km parking lot that snakes through the megacity; Vancouver commuters on their way to the downtown core from southern suburbs like Surrey stare down monstrous bottlenecks every day at river crossings like the Pattullo Bridge.
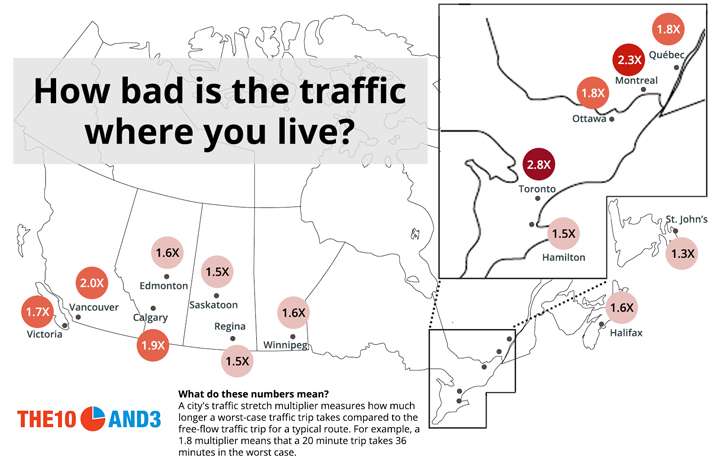
We set out to measure just how bad traffic can get in Canadian cities by examining the worst case scenarios for common driving routes (other studies have looked at numbers like hours lost in traffic per year). In particular, we considered a variety of routes in each major Canadian city — point-to-point trips across town, commutes from the suburbs to downtown, and a trip from the airport to the city’s central transit hub — and compared (using the Google Maps traffic planning tool) how long the worst-case trip takes versus a no-traffic free flowing trip. We define the worst-case trip as the highest amount of time predicted at the top of Google Maps’ prediction range over the course of an entire week.
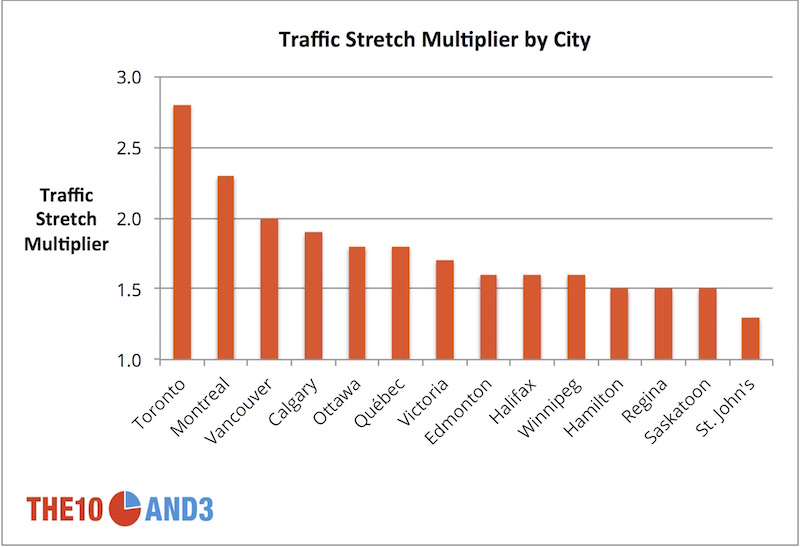
We call this ratio between the worst-case trip and the free-flow trip the traffic stretch multiplier for that route, and calculate a city’s overall traffic stretch by averaging across the different types of routes. Where the traffic stretch is relatively low — in smaller cities like St. John’s or Saskatoon, for example — it’s enough for drivers to give themselves just a few extra minutes leeway when planning their trip. But where the traffic stretch is highest — in a monster-traffic city like Toronto and to a lesser extent in Montreal and Vancouver — drivers must plan for plenty of extra time in case traffic quickly turns sour. See the methodology section for more details on our calculations.
The Ranking
Toronto
Toronto experiences by far the largest traffic stretch of any Canadian city, with the typical route taking up to 2.8 times longer in the worst case than the free-flow trip. The problem, as Torontonians know too well, is with the city’s ill-equipped expressways and highways. While a trip downtown from dense residential areas like Markham in the north or Scarborough in the northeast could take under a half hour in free-flow traffic, commuters in peak traffic can expect a voyage of well over 75 minutes. The Gardiner Expressway, the hulking elevated roadway cutting off the city from its Lake Ontario harbour, is the bane of many a Toronto driver; an otherwise leisurely 18-minute ride from the Beach in the east to High Park in the west could take 45 minutes or more at the worst times. And forget getting down to Union Station from Pearson airport in a reasonable amount of time; major backups on the Gardiner and Highway 427 can give this route a stretch multiplier of 3X or more (although the much heralded and speedy Union Pearson Express train which links these two hubs remains woefully underused).
Montreal and Vancouver
While the country’s second and third largest cities – Vancouver and Montreal – don’t hold a candle to Toronto when it comes to traffic stretch, they have alternately taken the crown for worst traffic in Canada in various past studies. And our analysis still finds plenty of evidence to suggest that being a driver there can be a miserable experience. Montreal, where the typical route can take 2.3 times longer at the worst time compared to free-flow traffic, has severe congestion both on the island (think the north-south Décarie) as well as on bridges leading to the city from off-island (like the toll Champlain Bridge from Brossard, the busiest single span bridge in the country).
Like Montreal, Vancouver’s traffic woes are exacerbated by the bodies of water that surround it. With a traffic stretch of 2.0, Vancouver is hamstrung by the network of congested river crossings to its north, east and south. The new tolled Port Mann Bridge actually provides a quick crossing for Surrey commuters, but is vastly underused, as drivers opt instead for free bridges like the overcrowded Pattullo Bridge. To the north of the city, the Second Narrows Bridge is getting worse and worse for commuters, as the region experiences a boom in employment as well as population growth.
The Relative Lightweights
Much of the rest of Canada faces far less severe traffic stretch than the big three of Toronto, Montreal and Vancouver. And perhaps this is not much of a surprise: with only Ottawa, Calgary and Edmonton (just barely) exceeding the 1 million population threshold, Canada’s urban roadways have so far been able to handle traffic volume rather well.
But some cities are starting to notice the unpleasant congestion that creeps in when a population is starting to overgrow its aging infrastructure. Calgary’s Deerfoot Trail is already developing a reputation for nasty rush hour traffic — a commute downtown from a southeastern suburb like MacKenzie Town that used to take only 20 minutes a decade ago in free-flow traffic can now run almost 50 minutes in the worst case; Ottawa’s Queensway, along a route leading downtown from suburban communities like Barrhaven or Stittsville, can produce traffic stretch multipliers of 2 or more in the worst case.
Methodology
We examined the 9 largest metro areas in the country by population, and added five smaller cities for geographic diversity (Halifax, Victoria, Saskatoon, Regina and St. John’s). For each city, with the help of local experts, we compiled three types of routes:
- one route from the city’s main airport to the city’s main transit hub (or equivalent central hub). Ex. YYZ -> Union Station in Toronto, YUL -> Gate Centrale in Montreal, YWG->Portage and Main in Winnipeg.
- a set of routes from suburban residential areas to downtown commuter destinations. Ex: Coral Springs -> Olympic Plaza in Calgary, Barrhaven -> Rideau Centre in Ottawa, Sherwood Park -> City Hall in Edmonton.
- a set of point-to-point routes between popular destinations within the city. Ex: UBC -> Hillcrest Centre in Vancouver, Beacon Hill Park -> Mount Douglas Park in Victoria, Churchill Square -> Signal Hill in St. John’s.
For each route, we used the route prediction tool on Google Maps to find the free-flow time and the worst-case time along that route. The free-flow time is defined as the shortest time required to traverse that route (which usually occurs in the middle of the night); for the worst-case time, we looked at the top of Google’s prediction range, and defined the worst-case time as the highest value of this top prediction value over the course of an entire week. We can then compute a traffic stretch multiplier for each route by taking the ratio of the worst case to the free-flow case, and a traffic stretch multiplier for each type of route by averaging across those routes. The city’s overall traffic stretch multiplier is the average traffic stretch multiplier across the three types of routes.
Route data was collected in early October. We note that Google’s traffic prediction model is constantly being updated (though none of the routes change too drastically), so values may have changed slightly since the data was collected.
Don’t miss our newest stories! Follow The 10 and 3 on Facebook or Twitter (@the10and3) for the latest news and analysis.