Canada has a well-deserved reputation as one of the most diverse nations on Earth. One in five Canadians reported speaking a language other than English or French, and over 200 distinct mother tongues were reported to the census in 2011. In Canada’s biggest and most multicultural city, Toronto, over half the population is foreign born, with over 140 languages or dialects spoken within the megacity’s limits.
Last year, to visualize this remarkable diversity, we constructed a language map showing the most common non-official language in each region of the country. With Tagalog dominating in the Yukon, German in the Prairies and Chinese in the country’s big cities, it was fascinating to see how the most common immigrant languages have spread throughout the nation.
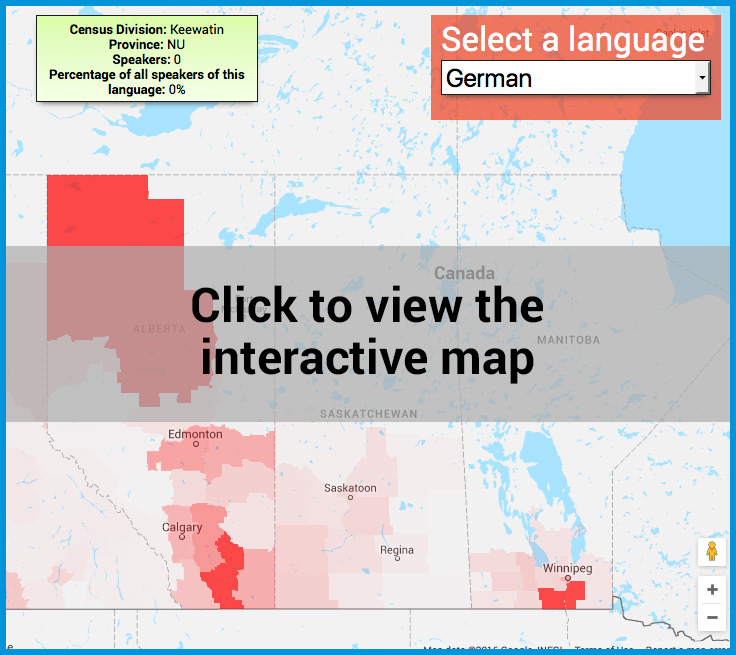
But many very sizable immigrant languages still flourish in Canada’s cities and countrysides despite not dominating in any particular region. So we built a map showing the geographical distribution of every single language reported to the Canadian census in 2011. To view the map, click the image below.
Russian, for instance, is the primary language spoken at home for over 100,000 residents in Canada. Almost half of these speakers reside in the city of Toronto or suburban York region to the north, with the remainder in mostly big cities like Montreal and Vancouver. Punjabi, with well over 300,000 speakers, has giant communities in Greater Vancouver and Ontario’s Peel region, but virtually no presence east of Toronto. Canada’s Arabic-speaking community, on the other hand, with over 180,000 members, is focused primarily in Montreal, with smaller pockets in Toronto, Ottawa, Calgary and Windsor.
Yet even smaller immigrant communities display fascinating geographic patterns. The 20,000-strong Japanese-speaking community resides almost exclusively in and around Vancouver, while the country’s modest group of Finnish speakers (numbering just over 3000) is concentrated in northern Ontario.
Methodology
For the map, we divided the country into census divisions, and for each language we display the number of residents in that division that report primarily speaking the language at home, based on data from the 2011 census.
As in our previous map, all Chinese dialects are grouped together. Why? Statistics Canada permits census respondents to indicate both a specific dialect of Chinese (e.g. Cantonese, Mandarin, Shanghainese, Hakka, etc.) or simply “Chinese”. Most respondents to the census select “Chinese” rather than their particular dialect, so there is unfortunately no way of knowing accurate numbers for individual dialects. As such, we decided to combine all Chinese dialects plus the generic “Chinese” into a single category.