As the fastest growing metropolitan area in Canada, Calgary is starting to face its share of big city problems: a surging crime rate, a tumultuous housing market tied to global oil prices, and perhaps most grating of all, the worsening gridlock.
When we looked at the state of traffic in Canada, Calgary’s congestion turned out to be similar to some of the country’s worst offenders, including Vancouver and Ottawa. But despite the city having a reputation for its reliance on cars, Calgary is working hard to diversify its transit options before traffic goes from bad to worse. Public transit is being embraced, with an aggressive plan to expand the city’s popular LRT system, while improved cycling and walking infrastructure is gradually being introduced to a hesitant populace.
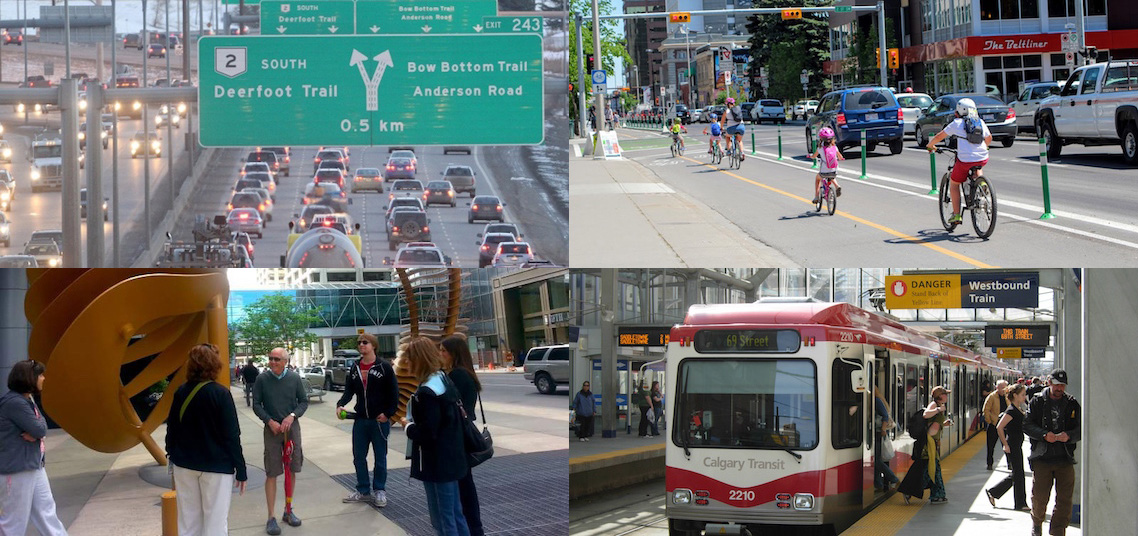
To understand the mix of transportation options used by Calgarians, we dove into the data to see how residents of the Stampede City manage to get to and from their jobs, be it by car, bike, foot, or public transit. Using data from the 2011 National Household Survey, we sliced up the city into census tracts, and mapped what percentage of employed residents in each area use each mode of transit as their main method to get between home and work.
Driving
Not surprisingly, Calgary is a city dominated by vehicles of the 4-wheeled variety as almost 9 in 10 of its residents live in low density suburban environments. The map makes it very clear: outside of the city centre, more than three quarters of commuters are hitting the road each day for what can be a long and grueling trip. Only deep in the city centre does the reliance on cars dip substantially, yet even there, over 20% of Calgarians are driving to work.
Public Transit
At first glance, Calgary’s public transit usage numbers do not look encouraging. Fewer people rely on buses and trains in Calgary (17%) than in Toronto (24.3) Montreal (23.1) or Vancouver (20.8%), and those cities arguably feature a similarly entrenched car culture.
But the news is not all grim. With Calgary’s historical efforts to stem the reach of highways into downtown and limit the number of parking spaces in the city centre, driving is not made to be a particularly attractive option. So it makes sense how the C-train, which opened in 1981, has become such a success, boasting the second highest ridership among all light rail systems in North America. Public transit usage appears to continue growing in Calgary, despite the city’s continual sprawl in all directions.
Indeed, along much of the blue and red lines of the C-train, upwards of 20% of commuters use public transit as their primary mode of transportation, with a peak of 36.1% of commuters in the Downtown West End. Compare this to our study of Toronto, however, where over 60% of residents rely on public transit in that city’s hottest spots.
Walking
Let’s face it. In a city as spread out and car-centric as Calgary, it’s tough to get to work by foot. Nevertheless, over 40% of downtown residents eschew the comforts of a car or train (or bike) to commute to work, even in the winter. The city recently developed its first major pedestrian strategy, Step Forward, which is an ambitious effort to expand walking to more people in the city. Some of the recommendations, like improving intersection signals, building pedestrian overpasses and installing new lighting, address purely infrastructure concerns, while other education efforts, like encouraging homeowners and businesses to promptly clear ice and snow from their properties, requires a cultural shift that may be harder to attain.
Cycling
Calgary is certainly not known for its cycling culture, and usage patterns reflect this as the percentage of commuters who cycle to lower is much lower than in cities like Toronto and Vancouver. Nevertheless, the numbers suggest that cycling is on the rise, particularly in neighbourhoods like Parkdale and Ramsay. Since counters began tracking rides in 2014, ridership rose 200% at several locations along Fifth Street S.W. and jumped more than 300% on parts of 12th Avenue S.W. Outside of a few select areas within the city, however, cycling appears to be a non-starter for most commuters, registering as the preferred choice of fewer than 2% of people going to work.
Methodology
Statistics Canada collects commuting data for employed residents over the age of 15. Each mode of transit we consider must be a resident’s main mode of transport to travel between home and work in order to be counted. Census tracts represent the most granular slicing of a city that Statistics Canada considers, and typically represents an area with between 2,500 and 8,000 residents.
Don’t miss our newest stories! Follow The 10 and 3 on Facebook or Twitter for the latest made-in-Canada maps and visualizations.