
You want to live a long and healthy life? Most Canadians know that British Columbia has found the formula for success, with its active outdoor lifestyle, low smoking and obesity rates, and remarkably high overall life expectancy (82.2 years). But not all places in Canada are as fortunate. Many regions of the country face grinding health problems. In some regions of Saskatchewan, for instance, about one in three residents are obese, while the Timiskaming region of Ontario has a shocking 17% diabetes rate. And while Canada’s smoking rate continues to drop precipitously, half of Nunavut’s adults are still lighting up on a daily basis. When it comes to the health of its citizens, it turns out that Canada is a nation of extremes.
Mapping the Health of the Nation
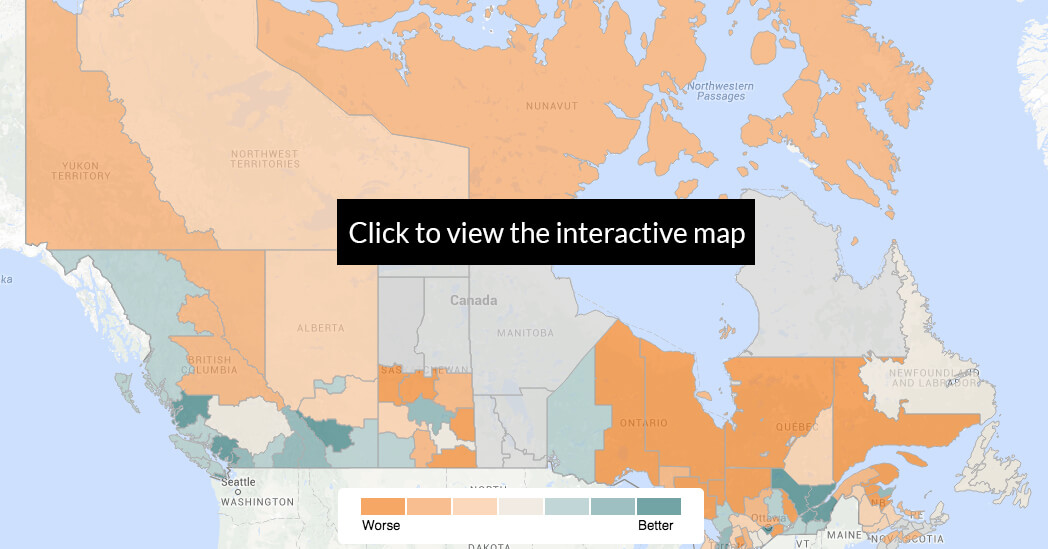
We set out to map all of Canada according to how healthy — or sick — its residents are. While some past studies, like those by The Conference Board, have graded each province and territory according to aggregate health statistics, let’s be honest — a province like Ontario is a big, diverse place. The metropolis of Toronto, for instance, an overall healthy city, is far removed from the alarming situation in remote Timmins (among the least healthy places in Canada, with high rates of asthma, obesity and cancer).
We divided the country into its 117 health regions — the most granular subdivision of the country that StatsCan uses to track health data — and looked at seven key health indicators from StatsCan’s 2013 Health Profile: the rate of asthma, diabetes and cancer; access to medical doctors; daily smoking rate; rate of overweight residents; and perceived mental health. These indicators were selected based on the availability of high quality data, and their ability to give a relatively comprehensive and broad portrait of a region’s health. Each region was then ranked according to a composite health score, calculated by first ranking each region within each of the seven health indicators, and then taking the average ranking across the indicators. See the Methodology Section at the end of the article for more details and justification for these choices.
Finally, we note that as with other Canadian studies that make use of StatsCan’s health data, there can be significant holes in what some provinces collect (a disappointing state of affairs for a modern, developed nation like Canada, to be sure). As such, we can include only 101 of the country’s 117 health regions in our ranking, unfortunately leaving out a few isolated areas of Saskatchewan, Quebec and Nova Scotia, as well as most of Manitoba.
Top 10 Unhealthiest Regions
| Rank (out of 101) | Health Region |
| 101 | Prince Albert Parkland Region (SK) |
| 100 | Région de la Gaspésie – Îles-de-la-Madeleine (QC) |
| 99 | Timiskaming (ON) |
| 98 | Porcupine (Timmins) Health Unit (ON) |
| 97 | Campbellton Area (NB) |
| 96 | Région de la Côte-Nord (QC) |
| 95 | Eastern Ontario Health Unit (ON) |
| 94 | Région du Nord-du-Québec (QC) |
| 93 | Prairie North Region (SK) |
| 92 | Région de Lanaudière (QC) |
The Urban – Rural Divide
What is perhaps most striking about our map is the clear urban-rural divide when it comes to Canadians’ health status. Of the top 10 healthiest regions, eight are in or around the metro areas of Toronto and Vancouver, with the remaining two in the Calgary and Quebec City metro areas. On the other hand, the 10 sickest regions are located overwhelmingly in rural and isolated areas of Quebec, Ontario and Saskatchewan.
Not surprisingly, lifestyle plays a critical role in this divide. The density of urban areas promotes everyday physical activity like walking, and with lower rates of smoking, less obesity, and more opportunity for recreational activities, residents of urban areas maintain a lower incidence of cardiovascular disease and diabetes than their rural counterparts. The city of Vancouver, for instance, has the lowest rate of obese residents in Canada (7.4%), while Saskatchewan’s rural Sun Country health region has the highest (36.1%).
The higher income and education levels usually found in urban areas have also been identified as being strongly related to improved health status, affecting everything from access to healthy foods, lower smoking and drinking rates, and access and use of quality healthcare and disease screening. Indeed, access to physicians remains one of the more stubborn barriers of the urban-rural divide; while Statscan shows that more than 85% of residents in and around the metropolitan Toronto region have regular access to a doctor (over 94% in York Region), fewer than 70% of residents in some parts of rural, northern Ontario regularly visit a doctor.
Top 10 Healthiest Regions
| Rank (out of 101) | Health Region |
| 1 | York Region (ON) |
| 2 | North Shore/Coast Garibaldi (BC) |
| 3 | City of Richmond (BC) |
| 4 | Halton Region (ON) |
| 5 | Région de la Chaudière-Appalaches (QC) |
| 6 | City of Calgary (AB) |
| 7 | City of Toronto (ON) |
| 8 | Frasier North (BC) |
| 9 | Peel Region (ON) |
| 10 | City of Vancouver (BC) |
The Challenges at the Bottom
Perhaps no region in Canada better epitomizes the many daunting challenges facing the country’s healthcare system than the Prince Albert Parkland Health Region (PAPHR), in central Saskatchewan, which ranks at the bottom of our list. At a glance, the health indicators here are certainly startling: over 9% of residents have diabetes, 42% are overweight, and 23% smoke on a daily basis. But the problems here go much deeper than mere numbers. Endemic poverty, disadvantaged First Nations communities, an aging population and a lack of doctors all bedevil this community, and serve as a stark warning sign for the rest of Canada.
With a population of just over 80 thousand, the region sees a mix of rural and urban residents, with just over half its population living in the city of Prince Albert (the 3rd largest in Saskatchewan). But Prince Albert, and its surrounding areas, are poor, with over 19% of its residents living on a low income, along with a high rate of long-term unemployed. And poverty has a direct effect on health. “Income and income insecurity, food insecurity, social exclusion [and] people living in poverty are significant factors in the population health status for this region,” according to a statement provided by the PAPHR.
Like other parts of the country that struggle with poor health outcomes, demographic factors also play a big role. The PAPHR point to their population structure, which they acknowledge is “different from many parts of the country and that demographic profile definitely plays a part in why some of these health status rates are elevated or of concern.” One community highlighted by the PAPHR as facing particular challenges is its Aboriginal population, which comprise 38.9% of the region’s residents as compared to 4.3% for Canada as a whole. With 12 First Nations, and an on-reserve population of 9000, Aboriginal households in PAPHR struggle with endemic food insecurity (as many as one in three Aboriginal households in PAPHR are classified as food insecure), low income levels (Aboriginal households earn 18% less than the average household in the region), and epidemic levels of diabetes (with an estimated one in four people living on reserves with the disease).
Other demographic features also play a major role in PAPHR’s poor health status. Compared to all of Canada, the region has “a higher proportion of children/youth and seniors and as a result higher dependency ratios (80.8% vs 57.4%),” as well as a “higher percentage of lone parent families.”
Finally, like many rural communities in Canada, providing all residents with regular access to physicians is a constant struggle. StatsCan reports that only 76.2% of the area’s residents have such regular access; but surprisingly, PAPHR suggests that “the challenge for access to physicians is actually worse in the City of Prince Albert, where wait times for an appointment can be as long as month. There have been recruitment challenges for the privately owned and operated clinics in the [region’s] largest centre.” Prince Albert also faces a particularly acute health challenge for the “segment of the population that is extremely transient.” These families may be new arrivals from northern communities in search of economic opportunities, or moving from one end of the city to another chasing affordable housing, making it virtually impossible to establish a regular relationship with a physician.
Life is Good at the Top
York Region, a suburban expanse just north of the city of Toronto, slips in at the top position in our health ranking, boasting strong health indicators across the board. But the real standout in our rankings is British Columbia, which features four of the top 10 healthiest regions, and nine in the top 20. From Victoria in the west, through the greater Vancouver region and east to the Kootenays, British Columbians in the heavily populated south of the province enjoy some of the best standards of health in the country.

Vancouver’s Stanley Park
This certainly comes as no surprise to most west coasters; British Columbia is regularly ranked among the healthiest places to live in the world, with a recent study by the Conference Board suggesting only the Swiss and Swedes have it better. Moreover, the city of Vancouver frequently ranks impressively among the healthiest cities in the world (alongside well-known healthy-living havens like Copenhagen and Melbourne). The province’s healthy lifestyle plays the biggest role in these results, with the highest percentage of residents in Canada who are physically active, the lowest rate of obesity in the nation, and low daily smoking and drinking rates. And what does this all this healthy living add up to? The outcomes speak for themselves: the province boasts enviably low rates of respiratory illness, heart disease and stroke, and a remarkable life expectancy above 82 years, among the highest in the world.
Nunavut
The territory of Nunavut provides a fascinating glimpse into the complexity of health and healthcare in Canada, as well as the difficulty in interpreting data from Canada’s most remote regions. It is no secret that the Inuit of Canada’s North contend with a massive set of health challenges that set them apart from much of the rest of the country. The numbers are grim, and extreme: life expectancy is a meager 71.6 years (the worst in the country), half of adults in the territory smoke on a daily basis, and only one in 6 residents have regular access to a doctor (the lowest, by far). Suicide is now considered to be at epidemic levels, and alcoholism is rampant. The rates of tuberculosis are 70 times higher than the national average, while, alarmingly, seven in 10 Inuit women smoke during pregnancy.
Much of this is due of course to social challenges in the territory. But some of our data suggests that there may be room for hope in otherwise desperate circumstances. For instance, despite sky-high smoking rates, Nunavut has the lowest reported rate of asthma in the country at just 4.9%, though some skeptical researchers believe this is less a result of the region’s low pollution and more a function of under-diagnosis. Diabetes, which is fast becoming a scourge in the rest of Canada due to an increasingly sedentary, fast-food lifestyle, is remarkably rare in the territory, due perhaps to a combination of the traditional northern diet and genetic factors.
Methodology
Canadian Averages For Health Indicators
| Health Indicator | Canadian Average |
| Asthma | 8.3% |
| Diabetes | 6.3% |
| Cancer incidence | 404.9 per 100,000 people |
| Daily smoking rate | 15.3% |
| Access to medical doctors | 84.9% |
| Overweight | 34.0% |
| Perceived mental health | 72.2% |
Where is the data from? We use data from StatsCan’s 2013 Health Profile, which draws numbers from a variety of its component health surveys. Data for all seven of the variables that we consider except for cancer incidence comes from the 2011/2012 Canadian Community Health Survey, while StatsCan draws cancer incidence numbers from several sources.
Why did we pick these seven variables? Many variables in StatsCan’s Health Profile are not collected in all 117 health regions (for a variety of reasons). As such, we wanted to select as broad a selection of variables as possible given the availability and quality of data, as well as maintaining an ability to give a relatively comprehensive portrait of a region’s health.
Another major concern was to avoid excessive correlation between variables. For instance, while smoking and drinking rates obviously measure very different things, these variables turn out to be highly correlated when comparing ranked health regions. Including both variables in our metric would muddy the interpretation of any conclusions that we may make.
Instead, we picked a sort of maximal set of interesting and broadly available variables which have low pairwise correlation (this is why we picked rate of overweight as a proxy for physical activity, for instance, rather than obesity which is highly correlated with the rate of diabetes). That is not to say that these seven variables are statistically independent (being overweight and having diabetes are certainly related!). But they are sufficiently uncorrelated (in the linear, mathematical sense), and most importantly have sufficiently low Spearman’s rank correlation (for the data nerds among you), that looking at the rates across health regions is informative.
Why did we combine the variables in this fashion? As described above, we first ranked each of the 101 health regions for each of the seven variables, and then computed a composite health rank by averaging the seven variable-specific rankings. Uniform weights were used in the averaging. This is a standard methodology, used in many similar studies to combine ranked variables, including by the Conference Board and New York Times. As the Conference Board indicates in its methodology: “This is the standard approach used by most organizations in the absence of any compelling reason to apply different weights,” which is indeed the case in our study.
Don’t miss our newest stories! Follow The 10 and 3 on Facebook or Twitter for the latest news and analysis.